快制图表

快制图表

Create and export the chart as an image

Creator
朝勇 陈
平台
iOS
工具效率APP

This is a chart-making tool with rich functions. It supports various chart types such as pie charts, radar charts, line charts, etc., and is equipped with a highly customizable function. Users can freely adjust colors, sizes, themes, etc., and easily create personalized charts. At the same time, it also provides rich PPT template materials, such as progress bars, indicators, etc., making your presentations more professional. It supports Excel data import and online table creation, and can convert charts with one key, which is fast and convenient. Whether it is presented horizontally or vertically, it can be perfectly presented. It is a powerful assistant for you to create data visualizations and PPTs.

COMMUNITY PERKSMergeek 社区专属福利
独家限免 NEW每天发现一份惊喜
PRODUCT SCREENS / 10

点击查看界面细节

快制图表 产品截图 1快制图表 产品截图 2快制图表 产品截图 3快制图表 产品截图 4快制图表 产品截图 5快制图表 产品截图 6快制图表 产品截图 7快制图表 产品截图 8快制图表 产品截图 9快制图表 产品截图 10

Quickly and conveniently create chart and PPT templates and export them as images. Its features are as follows:

【Rich charts】Supports creating various charts, such as pie charts, radar charts, line charts, bar charts, scatter plots, etc.;

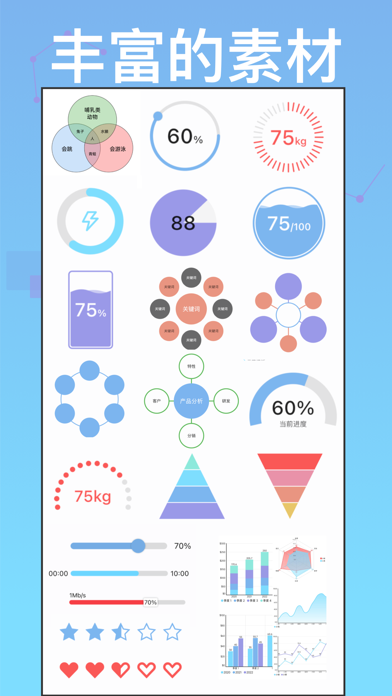
【Rich materials】Not only charts, but also supports various PPT template materials, such as progress bars, indicators, circular architectures, Venn diagrams, etc.;

【Easy to use】The user-friendly production interface, what you see is what you get for the appearance of the chart, allowing you to get started easily in minutes. At the same time, it supports importing data tables from Excel or creating tables online and converting them into charts with one key.

【High customization】The customization ability with extremely high freedom, allowing you to set colors, sizes, themes, etc. at will, and easily create your favorite style.

All supported charts:

- Pie charts (circular proportion charts, doughnut charts),

- Line charts (area charts),

- Vertical or horizontal bar charts (bar graphs, histograms),

- Radar charts (network charts, spider charts),

- Curve charts,

- Vertical or horizontal stacked bar charts,

- Scatter plots,

- Funnel charts,

- Butterfly charts,

- Line-bar mixed charts,

- Sankey diagrams

All supported materials:

- Venn diagrams

- Circular, linear, wavy progress bars

- Indicators

- Dashboards

- Pyramids

- Five-star rating components

- Circular bubble charts (commonly used in slides)

- Cards (supporting floating shadows and rounded corners)


[Terms of Use 使用条款]
https://www.apple.com/legal/internet-services/itunes/dev/stdeula/
[Privacy Policy 隐私协议]
https://www.privacypolicies.com/live/c9f1fdb4-1f3f-46bc-8e7e-5e1c05444926

你的真实体验,为其他用户提供宝贵参考,获得宝石奖励

REWARD MARKET100 宝石可兑换什么?

还没有公开评论,欢迎分享你的体验。

提交反馈

每一个想法,都让 Mergeek 更好一点。