Rivercast™ puts the river level data you need at your fingertips with our intuitive and interactive maps and graphs.
Whether you’re a boater, paddler, property owner, or just curious about your local waterways, Rivercast makes it easy to see exactly what’s happening on the rivers that matter to you.
Rivercast features include:
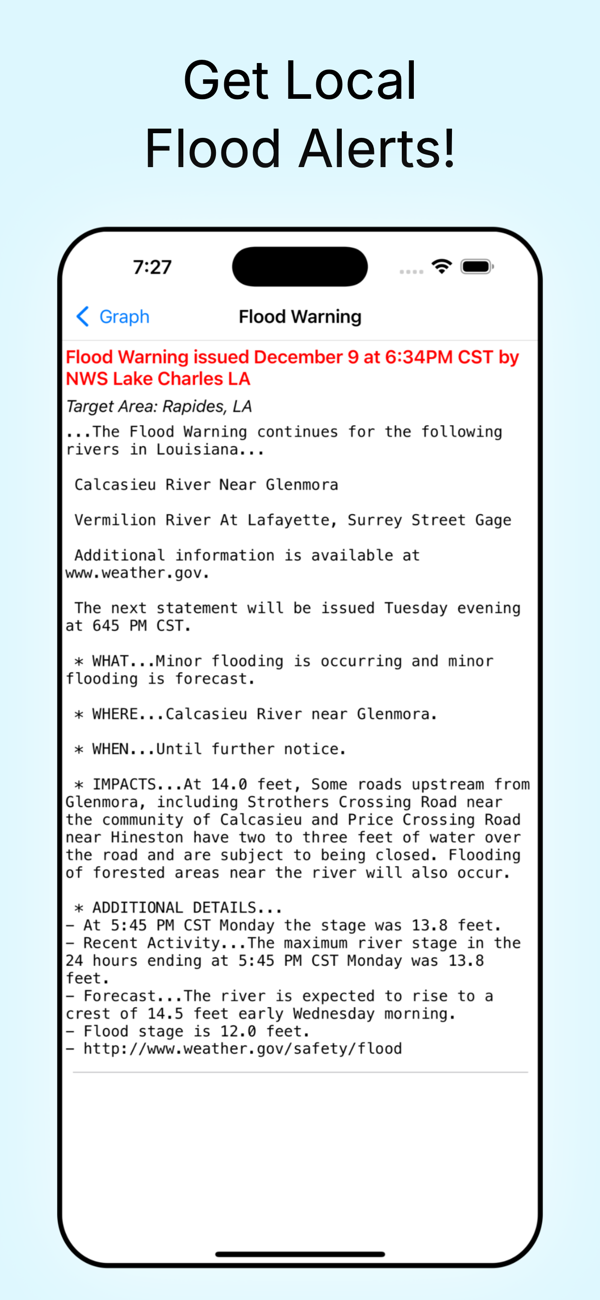
• Official flood warnings and alerts from the National Weather Service
• River stage height in feet
• River flow rate in CFS (when available)
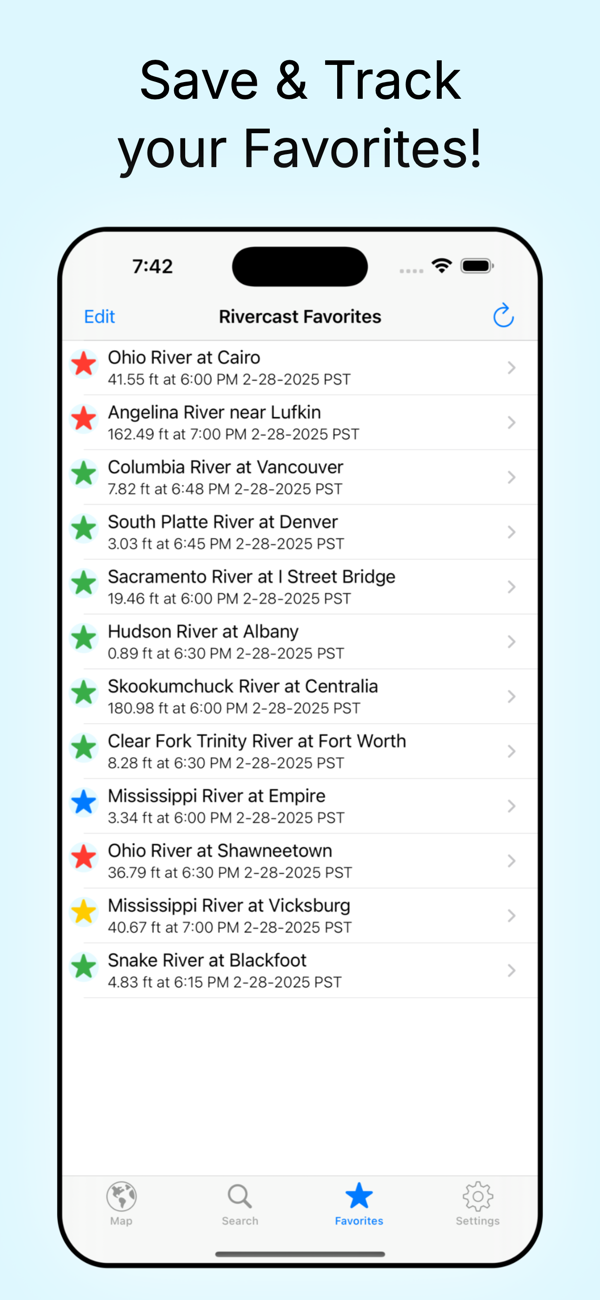
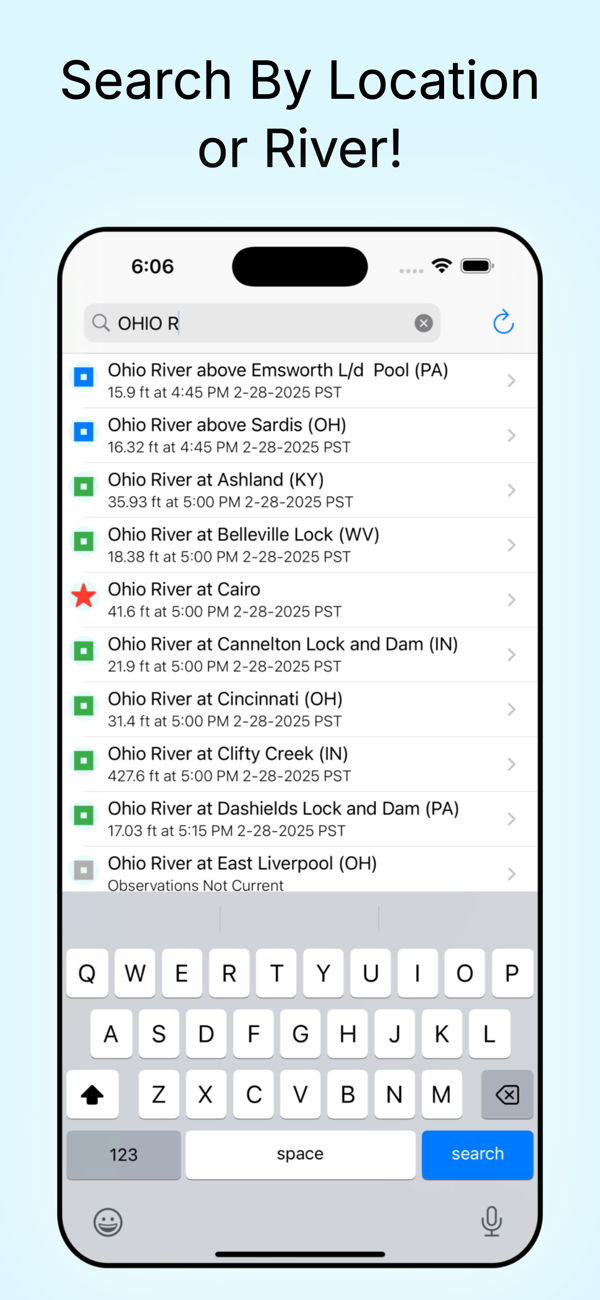
• Color indicators showing when a river is normal, rising, or flooding
• Current observations and recent history
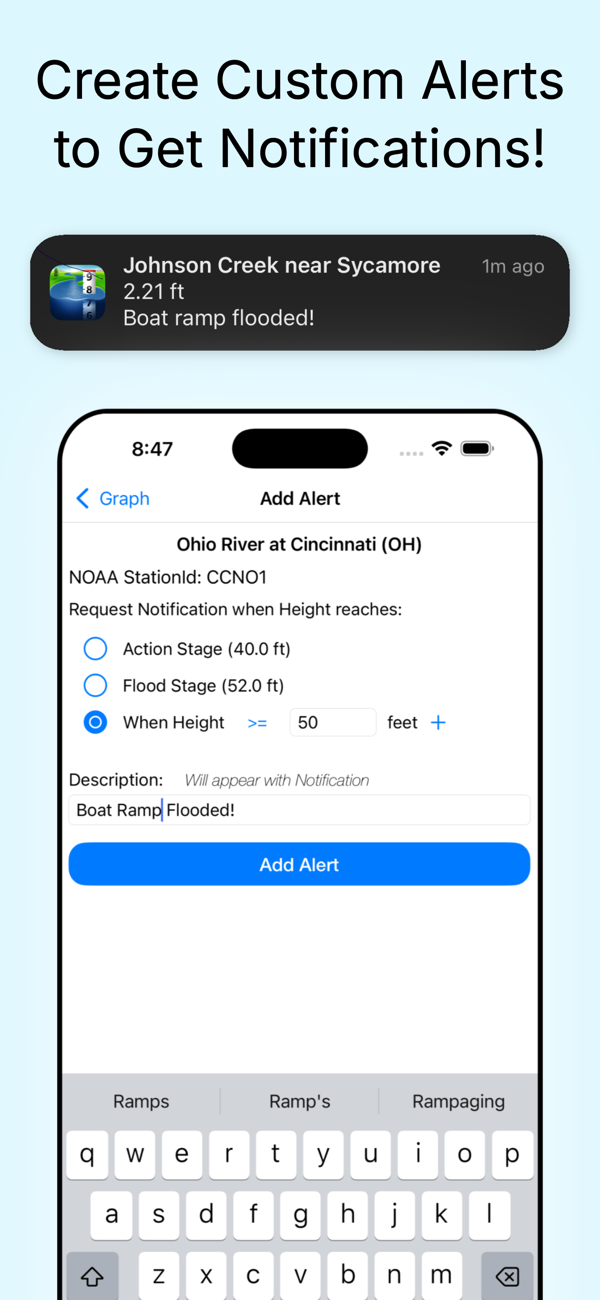
• Custom push notification alerts when a river reaches your chosen level (upgrade required)
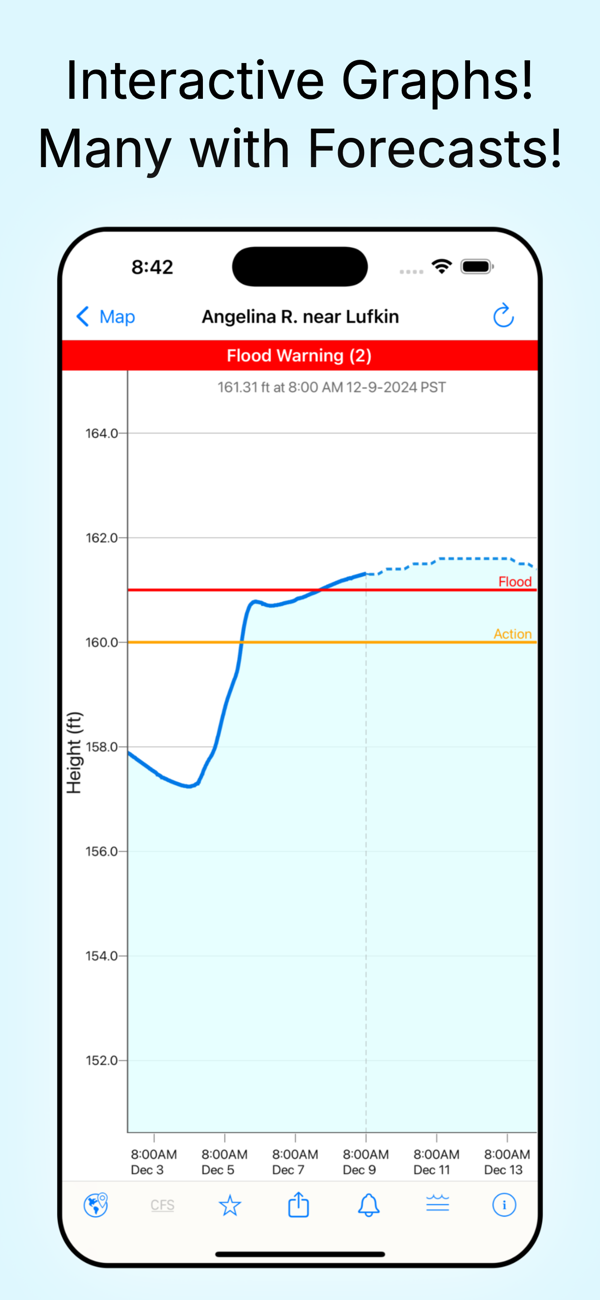
• NOAA river forecasts (when available)
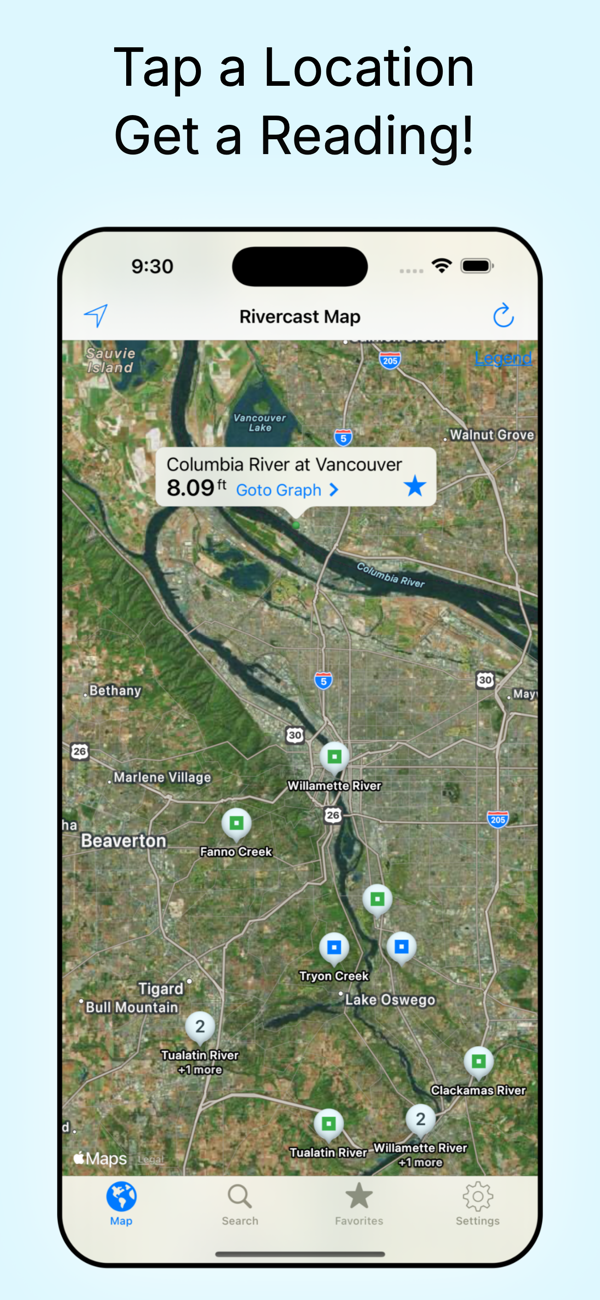
• Interactive map showing all nearby river gauges
• Search by waterway name, state, or NOAA 5-digit station ID
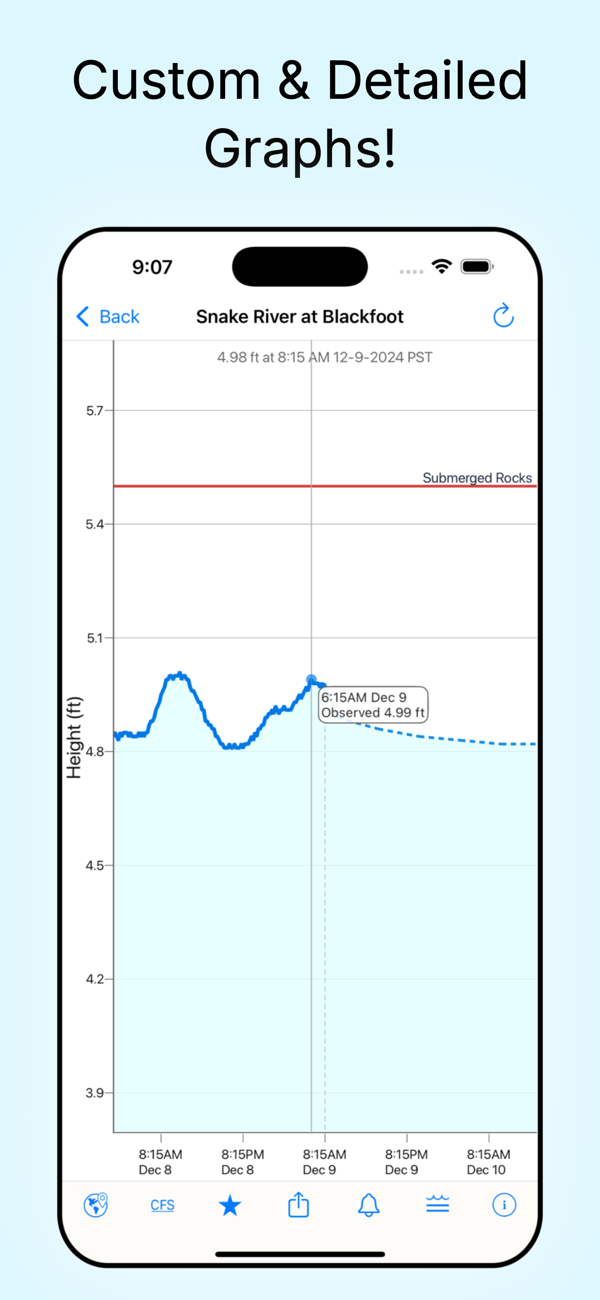
• Zoomable, pannable, interactive graphs
• Add your own reference lines for landmarks or safety levels
• Favorites list for quick access to your key locations
• Share graphs via iMessage, Email, Facebook, and more
• Full Dark Mode support
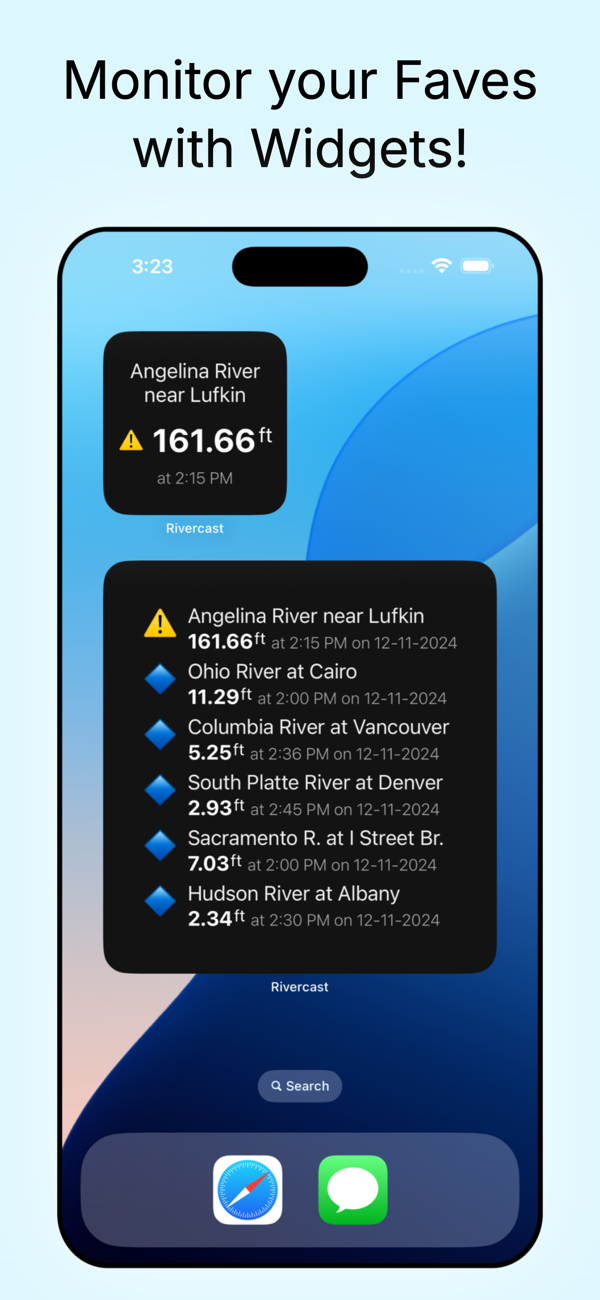
• Home Screen, Lock Screen, and StandBy Mode Widgets to monitor your favorites
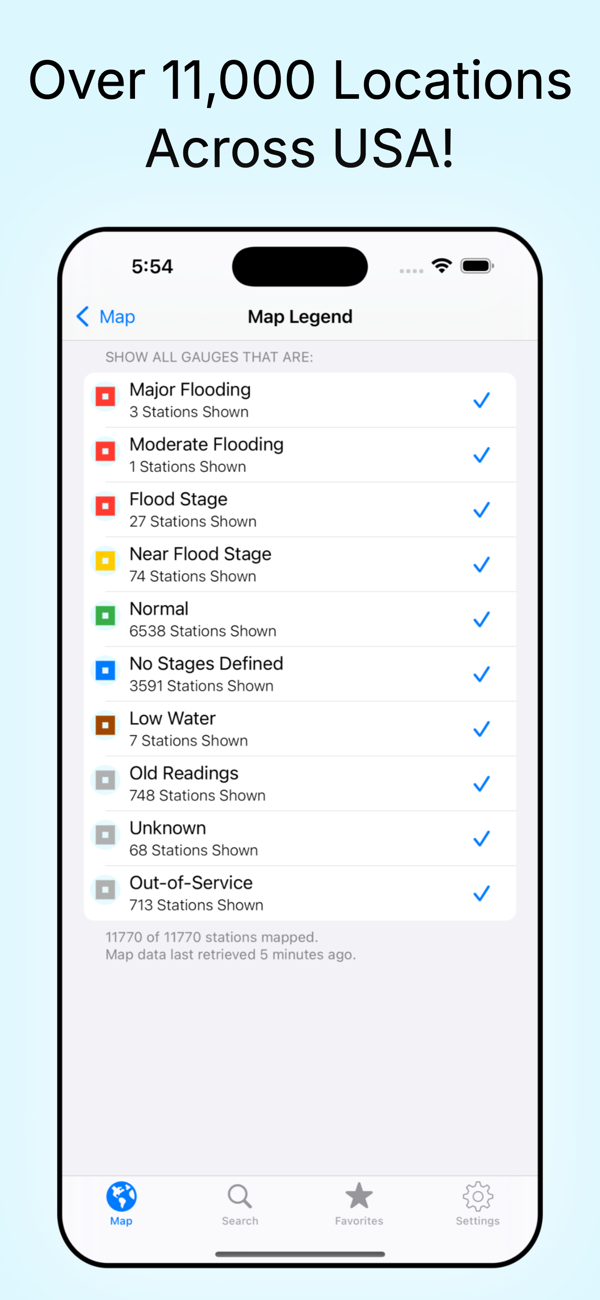
Rivercast’s map not only shows where gauges are located, but color-codes them to indicate whether each station is at normal levels, approaching flood stage, or above flood stage.
Tap any location to view the latest observations or open an interactive graph for detailed trends. Pinch or drag to zoom and pan, or tap and hold for precise readings using the crosshair tool.
Customize your hydrographs with personal level markers for bridges, sandbars, rocks, or safe navigation levels. Add favorite gauges for quick monitoring anytime.
Rivercast uses official NOAA observation and forecast data and requires an internet connection for data access. Data is displayed in feet or cubic feet per second (CFS) when available, always shown in your local time.
A trusted tool for boaters, fishermen, property owners, paddlers, scientists, and marine professionals who need clear, reliable river information.
River gauges reported are USA only.
We take our accuracy seriously!
* * * * * * * * * * * * * * * * * * * * * * *
Some Frequently Asked Questions:
Where does Rivercast get its data?
This app uses NOAA sources for its raw data for our custom graphing and mapping solutions. Some locations available only from other agencies (such as USGS) may not appear in this app.
Why does Rivercast sometimes show slightly different flow data (CFS) than USGS?
CFS is a calculated estimate derived from stage height. NOAA and USGS use different data models, so results can vary slightly—usually within a few percent. Stage height is always identical between NOAA and USGS, and designated flood stages are based on height in feet.
Why does Rivercast only show observations, but not forecasts, for my river?
NOAA provides forecasts for many, but not all, monitored rivers. Some forecasts are seasonal or only issued during high-water events.
My river gauge was there yesterday, but it’s gone today. Why?
River gauges occasionally have technical issues transmitting data or may even be washed out during flooding. Some are also seasonal. NOAA typically restores data within a few days or weeks.
Can you add location XYZ to your app?
We wish we could! If NOAA doesn’t report data for that location, we unfortunately can’t include it. Rivercast displays all stations that NOAA provides for public use.
For more information, visit www.RivercastApp.com
Terms of Use: https://www.apple.com/legal/internet-services/itunes/dev/stdeula

 +100宝石


 分享
分享


用户评价
立即分享产品体验
你的真实体验,为其他用户提供宝贵参考
💎 分享获得宝石
【分享体验 · 获得宝石 · 增加抽奖机会】
将你的产品体验分享给更多人,获得更多宝石奖励!
💎 宝石奖励
每当有用户点击你分享的体验链接并点赞"对我有用",你将获得:
🔗 如何分享
复制下方专属链接,分享到社交媒体、群聊或好友:
💡 小贴士
分享时可以添加你的个人推荐语,让更多人了解这款产品的优点!
示例分享文案:
"推荐一款我最近体验过的应用,界面设计很精美,功能也很实用。有兴趣的朋友可以看看我的详细体验评价~"
领取结果