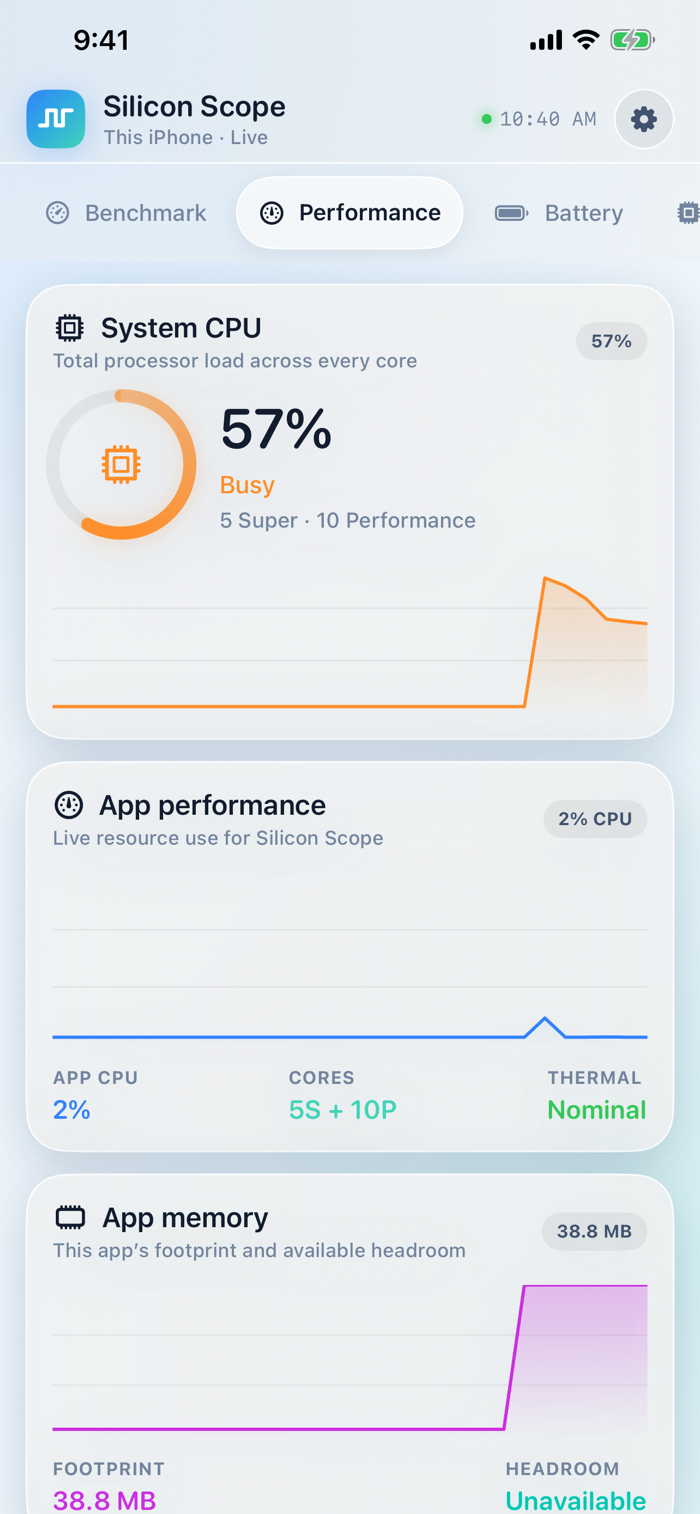
Silicon Scope is a system monitor for iPhone and iPad that shows what your hardware is actually doing, in real time, and measures it when you want a number instead of a graph.
See total processor load and a live graph for every logical core, split by performance and efficiency cluster so you can tell which kind of core is doing the work. Watch memory, storage, battery, and network activity update as they happen.
LIVE MONITORING
- System-wide CPU load with a graph per logical core
- Performance and efficiency core clusters identified separately
- Network throughput, local IP and IPv6 address, and interface details
- Storage capacity and available space
- Battery charge, state, Low Power Mode, and thermal state
- Metal graphics device capabilities and this app's allocation
- Live thread list for the app itself, with names and CPU share
BENCHMARK
- Integer throughput and single-core floating point
- Multi-core scaling across every core
- Memory bandwidth
- Metal compute throughput on the GPU
A run takes a few seconds and reports raw units, GFLOPS, GB/s, and operations per second, alongside an index score.
TRACK RESULTS OVER TIME
Every run is kept on device, up to the most recent 100. A chart plots any single category across your runs, so you can see whether this device is holding its performance or losing it. The run log lists each result with the change from the run befor...


 +100宝石

 分享
分享










用户评价
立即分享产品体验
你的真实体验,为其他用户提供宝贵参考
💎 分享获得宝石
【分享体验 · 获得宝石 · 增加抽奖机会】
将你的产品体验分享给更多人,获得更多宝石奖励!
💎 宝石奖励
每当有用户点击你分享的体验链接并点赞"对我有用",你将获得:
🔗 如何分享
复制下方专属链接,分享到社交媒体、群聊或好友:
💡 小贴士
分享时可以添加你的个人推荐语,让更多人了解这款产品的优点!
示例分享文案:
"推荐一款我最近体验过的应用,界面设计很精美,功能也很实用。有兴趣的朋友可以看看我的详细体验评价~"
关注 Mergeek 公众号
领奖遇到问题?联系小门助手